-
Navigating Interactive Reporting
-
Interactive Reports Descriptions
-
Report Scenarios
-
Report Analysis Questions
Individual Results
Class Roster
- List of students, some identifying elements (e.g. Student ID or DOB), and corresponding test and score information in a tabular view
- Includes results from a single test session
- Allows User (Teacher) to quickly sort Student results in a specific sequence or filter down to a subset of Students (e.g. certain performance levels or scale score ranges)
- Provides one-click access to Individual Student Reports (ISR) for viewing, download, and print
- Includes an option to view each content area (Math/ELA) separately or combined, along with 3 predefined views for Overall Content; Subject Area; and Reporting Category
Longitudinal Roster
- List of students, some identifying elements (e.g. Student ID or DOB), and corresponding test and score information in a tabular view
- Includes results from multiple test sessions
- Allows User (Teacher) to quickly identify the change (growth or regression) in score/performance between different instructional and testing periods
- Users can sort Student results in a specific sequence or filter down to a subset of Students (e.g. certain performance levels or scale score ranges)
- Provides one-click access to Individual Student Reports (ISR) for viewing, download, and print
- Includes an option to view each content (Math/ELA) area separately or combined, and to specify a date range for relevant test sessions
Student Dashboard
- Dashboard of various measures and context related to Student testing results
- Includes all test results for a single Student at a time
- Specific views or information provided: Headline scores from most recent test event (by reporting category); scale scores for all tests over time (by reporting category); Comparisons to mean scores for groups
Group Results
Group Performance
- Displays scores and identifying information for a specified Student Group
- Includes results for multiple test sessions
- Different charts to provide a visual representation of Student scores and the change in scores between test events over time
- Users (Teachers) can select a Grade option to view the Performance Level cut points for different Grade/Content/Category combinations
- Includes an option to view each content area (Math/ELA) separately along with a predefined view for Reporting Category and a drill-down to a Group Learning Progression view
Comparison Report
- Summary level information for a single test event
- Different charts to provide a visual representation of percent of Students within each Performance Level and comparisons to mean scores at different levels
- Includes predefined views for District, School, and Class and sections for each Content Area tested
- Users (Teachers/School/District) can drill down to underlying data from the charts and link to additional views for each Reporting Category
Disaggregate Summary
- Summary level information for a single test event
- Different charts to provide a visual representation of percent of Students within a demographic group across each Performance Level along with comparisons to mean scores at different levels
- Includes sections for each Content Area tested
- Users (Teachers/School/District) can drill down to underlying data from the charts
Additional Reports
Group Learning Progression
- Displays scores and identifying information for a specified Student Group
- Includes results for a single test session
- Different charts to provide a visual representation of Student scores within reach Reporting Category and corresponding Band from the Learning Progression
- Users (Teachers) can select a Grade option to view the Performance Level cut points for different Grade/Content/Category combinations
- Option to drill down to underlying data from the charts and link to the Individual Learning Progression
Individual Learning Progression
- Displays scores and identifying information for a single Student
- Includes results for a single test session
- Features tabular views of Student scores within reach Reporting Category, the corresponding Band from the Learning Progression, and the associated Standards and Descriptions
- Users (Teachers) can see the Band and Standards that align with the Student’s scores (“Tested Standards”) along with the Standards associated with the next Band(s) in the progression (“Standards for Growth”)
Growth Projection
- Displays all test results for a single Student at a time
- Includes actual scores for: Student; School mean; and District mean along with a Projected score for each (representing “growth”)
- Different charts representing the same baseline information to satisfy user preferences (e.g. horizontal line; vertical column; grid/table)
- Includes sections for each Content Area tested
| I am...I want... | Report Name(s) | Key Data or Needs | ‘So What’ Uses |
| I am a teacher who just administered BEACON full battery. What reports should I first look at? (are these pinned?) | Individual Student Report, Group Performance Report, Student dashboard | Most recent test event results | Shows weaknesses, strengths, beginning-of-year snapshot |
| I am a teacher or principal who administered BEACON this fall. How can I compare my students to EOY performance last year? How can I compare to the current year intended performance? | Group Performance Reports; Class Comparisons, School Summary, Disaggregate Summary | ‘Look back’ instructions
Longitudinal roster (class level; compare across test events/school years) Also can use individual level, groups within/across school |
Understand possible learning gaps
Plan for instruction and intervention(s) Plan for professional learning |
| I want to understand what a scale score means vs a performance level. | Guidance documentation | Performance levels accompany scale scores: links to PLDs | Scale score allows for an accurate comparison across test forms and administration years within a grade or course and content area
Performance levels are defined by the overall scale score and used to report overall student performance by describing how well students met the expectations for the grade level/course |
| I am a district level user and I want to know how the domain performance scores from testlets impact a full test score | Guidance Documentation | Looking at the performance bands earned by students across reporting categories will help users see individual strengths and weaknesses (and the standards-based composition of each subject area’s test score) | To understand a rationale for selecting one choice - testlest - over a full battery
If all testlets are given in a 30 day-window the full battery score is available |
| I am a teacher who wants to use student progress on standards to plan instruction | Learning Progression | PLDs
Looking at the next performance band to see a list of standards (and the contextual information) associated with the next level of performance |
Understand possible learning gaps
Plan for instruction and intervention(s) |
| I am a teacher trying to help a parent understand how their student compares to their peers | The Group Report would allow a teacher to talk about this - and an Individual Student Report with a class average comparison | Need scale scores over time, at the subject and the reporting category level, for both the student and the reference group (e.g., the student’s school) | A teacher can also provide this information in ‘round’ terms - e.g. XX number of students in the same performance area as your student or focus on the growth of that student over comparisons |
| I am a teacher trying to help a parent understand whether or not their student needs additional services. | Use the student Individual Report(s) to show the area(s) of need
The Learning Progressions report can show the more specific areas of need the teacher/student will next address |
Drawing from the performance bands earned by the student to determine strengths and weaknesses | Understand learning gaps and what the instructional planning and support will address |
| I am a teacher who would like to place students in groups with similar academic needs | The class roster reports and Learning Progressions show where students are and where they are ready to go next instructionally | Drawing from the performance bands earned by the student to determine strengths and weaknesses
PLD’s provide more granular information |
Sortable tables and graphs allow report uses to rank-order students by test score, Performance Level, or by change in test score from last year to this year |
| I am a teacher working with a student (and parents) to help set learning goals based on the latest DRC BEACON results | Use the Student Goal Setting Report in a 1-1 conference | Use the PLDs to see, in words, the granular knowledge and skill associated with each level
Educators can look at the description of the performance band a student has earned to see the standards/context associated with their current performance; and they can examine the next performance band’s information to help set goals |
Understand learning gaps and what the instructional planning and support should address |
| I am a school staff development committee member working with a team to define SMART goals for my school for the year. How should I use Beacon growth or other measures? | An appropriately permissioned person can provide school and district snapshot reports - 3 points in the year - and compare to performance as planned for grade level/subject | Pre-selected reports that are printed as PDFs and/or data that is downloaded into a local system for additional manipulation and or comparison | Setting and monitoring goals will use data from the previous year to watch for patterns of growth |
| I am a school district submitting an application for federal or state funding to support academic intervention and need measurement criteria to develop multi-tiered systems of support | District-wide results will allow the user to view students and the % that fall within tiers; use to develop and articulate interventions and consider their impact | Longitudinal rosters (district/site/class levels) allow comparisons across test events/school years | Users will likely use progress monitoring tools as well as BEACON Growth |
Analyzing DRC BEACON Data: Guiding questions for a district, site or PLC Team
- What areas of students’ performance are at or above expectations?
- What areas of student performance are below expectations?
- How did various groups (e.g. gender, race, socioeconomic, disability, English proficiency) of students perform?
- What are other data telling us about student performance in this area that confirms or creates additional questions?
- What confirms what we already know? What challenges what we thought?
- What important observations seem to “pop out” from the data? Surprising observations? Unexpected observations?
- What patterns or trends appear?
- What similarities and differences exist across various data sources?
- What do we observe at the school level? The grade level? The class level?
- What are some things we have not yet explored? What other data do we want to examine?
DRC BEACON Interactive Reports Descriptions
Individual Results
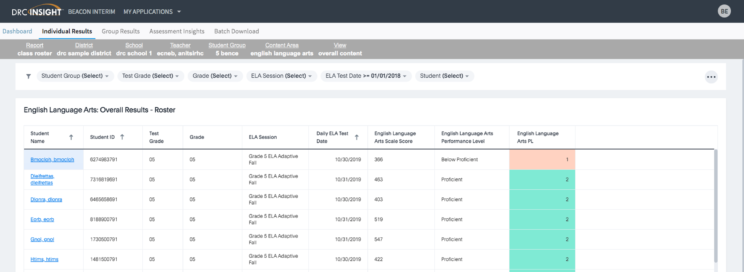
Class Roster
- List of students, some identifying elements (e.g. Student ID or DOB), and corresponding test and score information in a tabular view
- Includes results from a single test session
- Allows User (Teacher) to quickly sort Student results in a specific sequence or filter down to a subset of Students (e.g. certain performance levels or scale score ranges)
- Provides one-click access to Individual Student Reports (ISR) for viewing, download, and print. ONLY on the “All” / Overall views since the ISR will only be for complete and composite tests not individual testlets.
- Includes an option to view each content area (Math/ELA) separately or combined, along with 3 predefined views for Overall Content; Subject Area; and Reporting Category
- Choosing the Reporting Category or Subject Area view will populate another filter that allows users to select one Reporting Category/Subject Area or to go to a view with all. NOTE: when selecting the “All” view will only show Composite/Complete(Overall) tests.
Longitudinal Roster
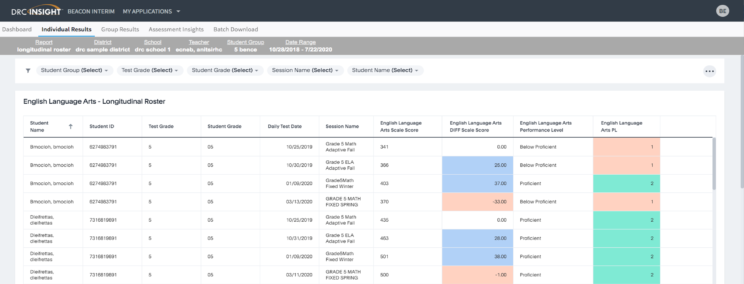
- List of students, some identifying elements (e.g. Student ID or DOB), and corresponding test and score information in a tabular view
- Includes results from multiple test sessions
- Allows User (Teacher) to quickly identify the change (growth or regression) in score/performance between different instructional and testing periods
- Users can sort Student results in a specific sequence or filter down to a subset of Students (e.g. certain performance levels or scale score ranges)
- Provides one-click access to Individual Student Reports (ISR) for viewing, download, and print
- Includes an option to view each content (Math/ELA) area separately or combined, and to specify a date range for relevant test sessions
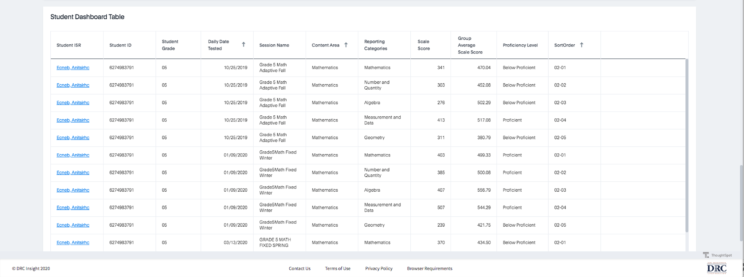
Student Dashboard
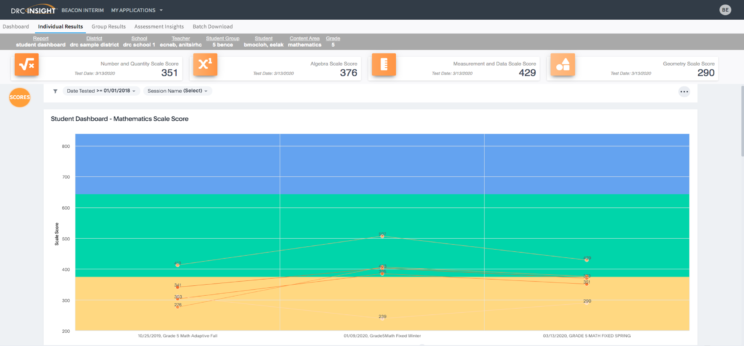
- Dashboard of various measures and context related to Student testing results
- Includes all test results for a single Student at a time
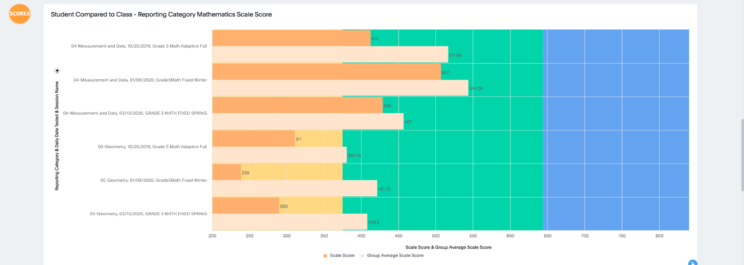
- Specific views or information provided: Headline scores from most recent test event (by reporting category (Math) and Subject Area (ELA)); scale scores for all tests over time (by reporting category, Overall Content, and Subject Area(ELA)); Comparisons to mean scores for the Student Group the student was apart of for the session.

Group Results
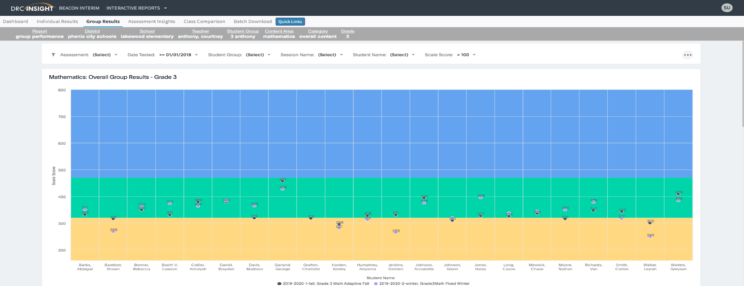
Group Performance
- Displays scores and identifying information for a specified Student Group
- Includes results for multiple test sessions
- Different charts to provide a visual representation of Student scores and the change in scores between test events over time
- Users (All users can do this.) can select a Grade option to view the Performance Level cut points for different Grade/Content/Category combinations
- Includes an option to view each content area (Math/ELA) separately along with a predefined view for Reporting Category and a drill-down to a Summarized view of Reporting Categories to assist user on identifying which Reporting Categories to pay attention to.


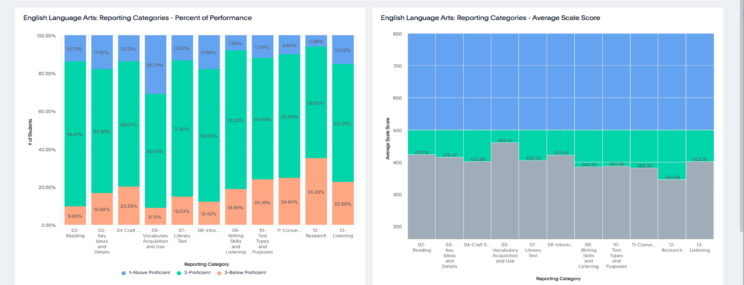
Comparison Report
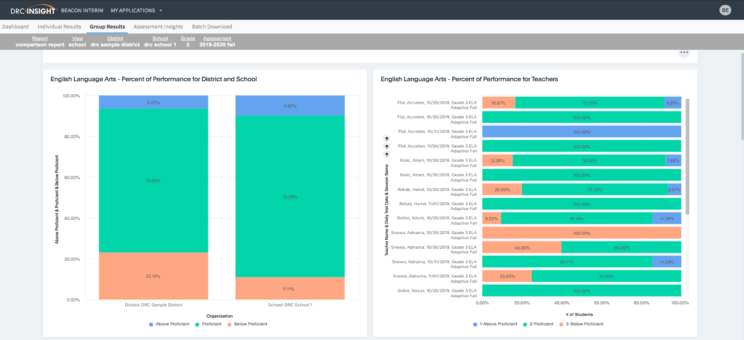
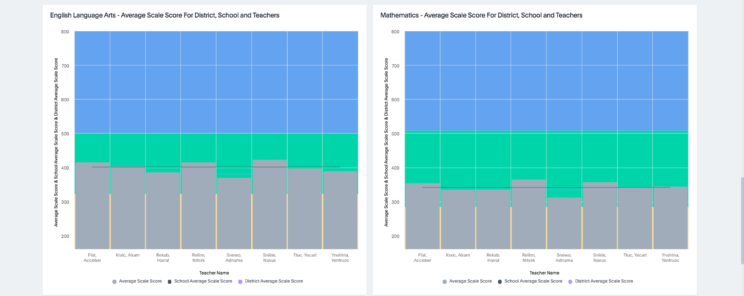
- Summary level information for a single test event
- Different charts to provide a visual representation of percent of Students within each Performance Level and comparisons to mean scores at different levels
- Includes predefined views for District, School, and Class and sections for each Content Area tested
- Users (Teachers/School/District) can drill down to underlying data from the charts and link to additional views for each Reporting Category


Disaggregate Summary
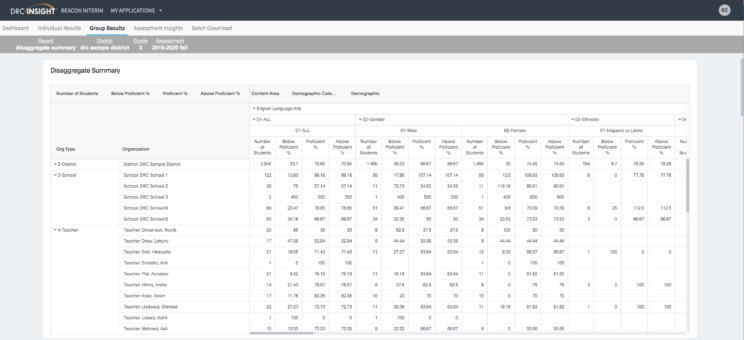
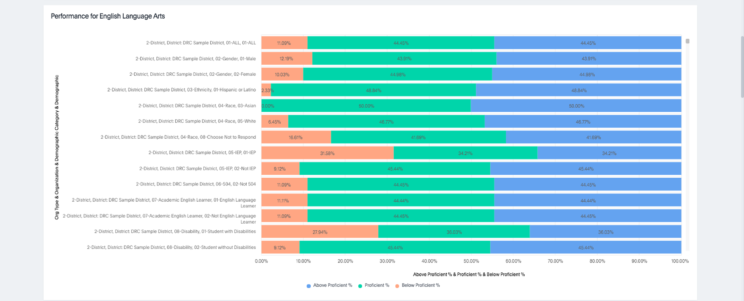
- Summary level information for a single test event
- Different charts to provide a visual representation of percent of Students within a demographic group across each Performance Level along with comparisons to mean scores at different levels
- Includes sections for each Content Area tested
- Users (Teachers/School/District) can drill down to underlying data from the charts


Additional Reports
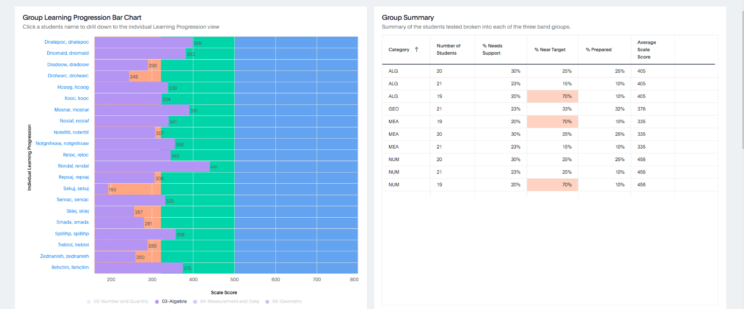
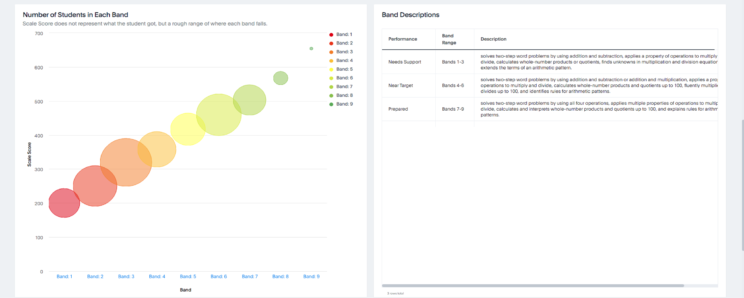
Group Learning Progression
- Displays scores and identifying information for a specified Student Group
- Includes results for a single test session
- Different charts to provide a visual representation of Student scores within reach Reporting Category and corresponding Band from the Learning Progression
- Users (Teachers) can select a Grade option to view the Performance Level cut points for different Grade/Content/Category combinations
- Option to drill down to underlying data from the charts and link to the Individual Learning Progression

Individual Learning Progression
- Displays scores and identifying information for a single Student
- Includes results for a single test session
- Features tabular views of Student scores within reach Reporting Category, the corresponding Band from the Learning Progression, and the associated Standards and Descriptions
- Users (Teachers) can see the Band and Standards that align with the Student’s scores (“Tested Standards”) along with the Standards associated with the next Band(s) in the progression (“Standards for Growth”)


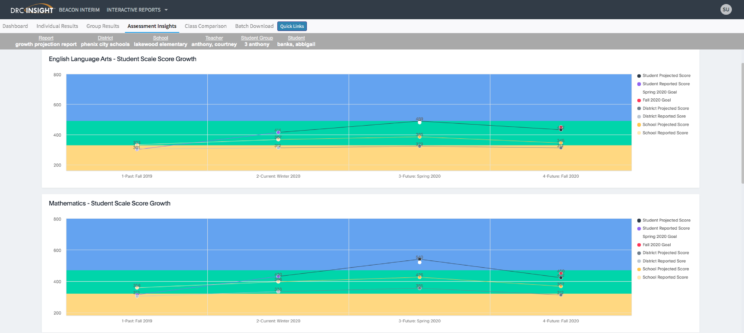
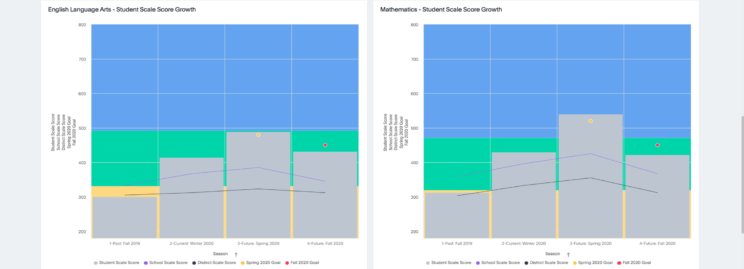
Growth Projection
- Displays all test results for a single Student at a time
- Includes actual scores for: Student; School mean; and District mean along with a Projected score for each (representing “growth”)
- Different charts representing the same baseline information to satisfy user preferences (e.g. horizontal line; vertical column; grid/table)
- Includes sections for each Content Area tested

Report Scenarios
| I am...I want... | Report Name(s) | Key Data or Needs | ‘So What’ Uses |
| I am a teacher who just administered BEACON full battery. What reports should I first look at? (are these pinned?) | Individual Student Report, Group Performance Report, Student dashboard
|
Most recent test event results | Shows weaknesses, strengths, beginning-of-year snapshot |
| I am a teacher or principal who administered BEACON this fall. How can I compare my students to EOY performance last year? How can I compare to the current year intended performance? | Group Performance Reports; Class Comparisons, School Summary, Disaggregate Summary | ‘Look back’ instructions
Longitudinal roster (class level; compare across test events/school years) Also can use individual level, groups within/across school
|
Understand possible learning gaps
Plan for instruction and intervention(s) Plan for professional learning |
| I want to understand what a scale score means vs a performance level. | Guidance documentation | Performance levels accompany scale scores: links to PLDs | Scale score allows for an accurate comparison across test forms and administration years within a grade or course and content area
Performance levels are defined by the overall scale score and used to report overall student performance by describing how well students met the expectations for the grade level/course |
| I am a district level user and I want to know how the domain performance scores from testlets impact a full test score | Guidance Documentation | Looking at the performance bands earned by students across reporting categories will help users see individual strengths and weaknesses (and the standards-based composition of each subject area’s test score) | To understand a rationale for selecting one choice - testlest - over a full battery
If all testlets are given in a 30 day-window the full battery score is available |
| I am a teacher who wants to use student progress on standards to plan instruction | Learning Progression | PLDs
Looking at the next performance band to see a list of standards (and the contextual information) associated with the next level of performance |
Understand possible learning gaps
Plan for instruction and intervention(s) |
| I am a teacher trying to help a parent understand how their student compares to their peers | The Group Report would allow a teacher to talk about this - and an Individual Student Report with a class average comparison | Need scale scores over time, at the subject and the reporting category level, for both the student and the reference group (e.g., the student’s school) | A teacher can also provide this information in ‘round’ terms - e.g. XX number of students in the same performance area as your student or focus on the growth of that student over comparisons |
| I am a teacher trying to help a parent understand whether or not their student needs additional services. | Use the student Individual Report(s) to show the area(s) of need
The Learning Progressions report can show the more specific areas of need the teacher/student will next address |
Drawing from the performance bands earned by the student to determine strengths and weaknesses | Understand learning gaps and what the instructional planning and support will address |
| I am a teacher who would like to place students in groups with similar academic needs | The class roster reports and Learning Progressions show where students are and where they are ready to go next instructionally | Drawing from the performance bands earned by the student to determine strengths and weaknesses
PLD’s provide more granular information |
Sortable tables and graphs allow report uses to rank-order students by test score, Performance Level, or by change in test score from last year to this year |
| I am a teacher working with a student (and parents) to help set learning goals based on the latest DRC BEACON results | Use the Student Goal Setting Report in a 1-1 conference | Use the PLDs to see, in words, the granular knowledge and skill associated with each level
Educators can look at the description of the performance band a student has earned to see the standards/context associated with their current performance; and they can examine the next performance band’s information to help set goals |
Understand learning gaps and what the instructional planning and support should address |
| I am a school staff development committee member working with a team to define SMART goals for my school for the year. How should I use Beacon growth or other measures? | An appropriately permissioned person can provide school and district snapshot reports - 3 points in the year - and compare to performance as planned for grade level/subject | Pre-selected reports that are printed as PDFs and/or data that is downloaded into a local system for additional manipulation and or comparison | Setting and monitoring goals will use data from the previous year to watch for patterns of growth |
| I am a school district submitting an application for federal or state funding to support academic intervention and need measurement criteria to develop multi-tiered systems of support | District-wide results will allow the user to view students and the % that fall within tiers; use to develop and articulate interventions and consider their impact | Longitudinal rosters (district/site/class levels) allow comparisons across test events/school years | Users will likely use progress monitoring tools as well as BEACON Growth |
Analyzing DRC BEACON Data: Guiding questions for a district, site or PLC Team
- What areas of students’ performance are at or above expectations?
- What areas of student performance are below expectations?
- How did various groups (e.g. gender, race, socioeconomic, disability, English proficiency) of students perform?
- What are other data telling us about student performance in this area that confirms or creates additional questions?
- What confirms what we already know? What challenges what we thought?
- What important observations seem to “pop out” from the data? Surprising observations? Unexpected observations?
- What patterns or trends appear?
- What similarities and differences exist across various data sources?
- What do we observe at the school level? The grade level? The class level?
- What are some things we have not yet explored? What other data do we want to examine?
